Forty years ago only 8% of people, in the UK, were self-employed. Today this number has now reached 15% as more people are encouraged to work for themselves and have freedom and control of their lives. Probably owing more to necessity than anything else in an uncertain climate and companies demanding more contractors instead of being willing to employ. But that’s just the negative side.
I grew up with two parents who were both self-employed and to me this seemed like a ‘no brainer’ choice. Why would anyone want to be employed and answer to a boss? I guess this was engrained into me and since an early age I only ever considered working for myself.
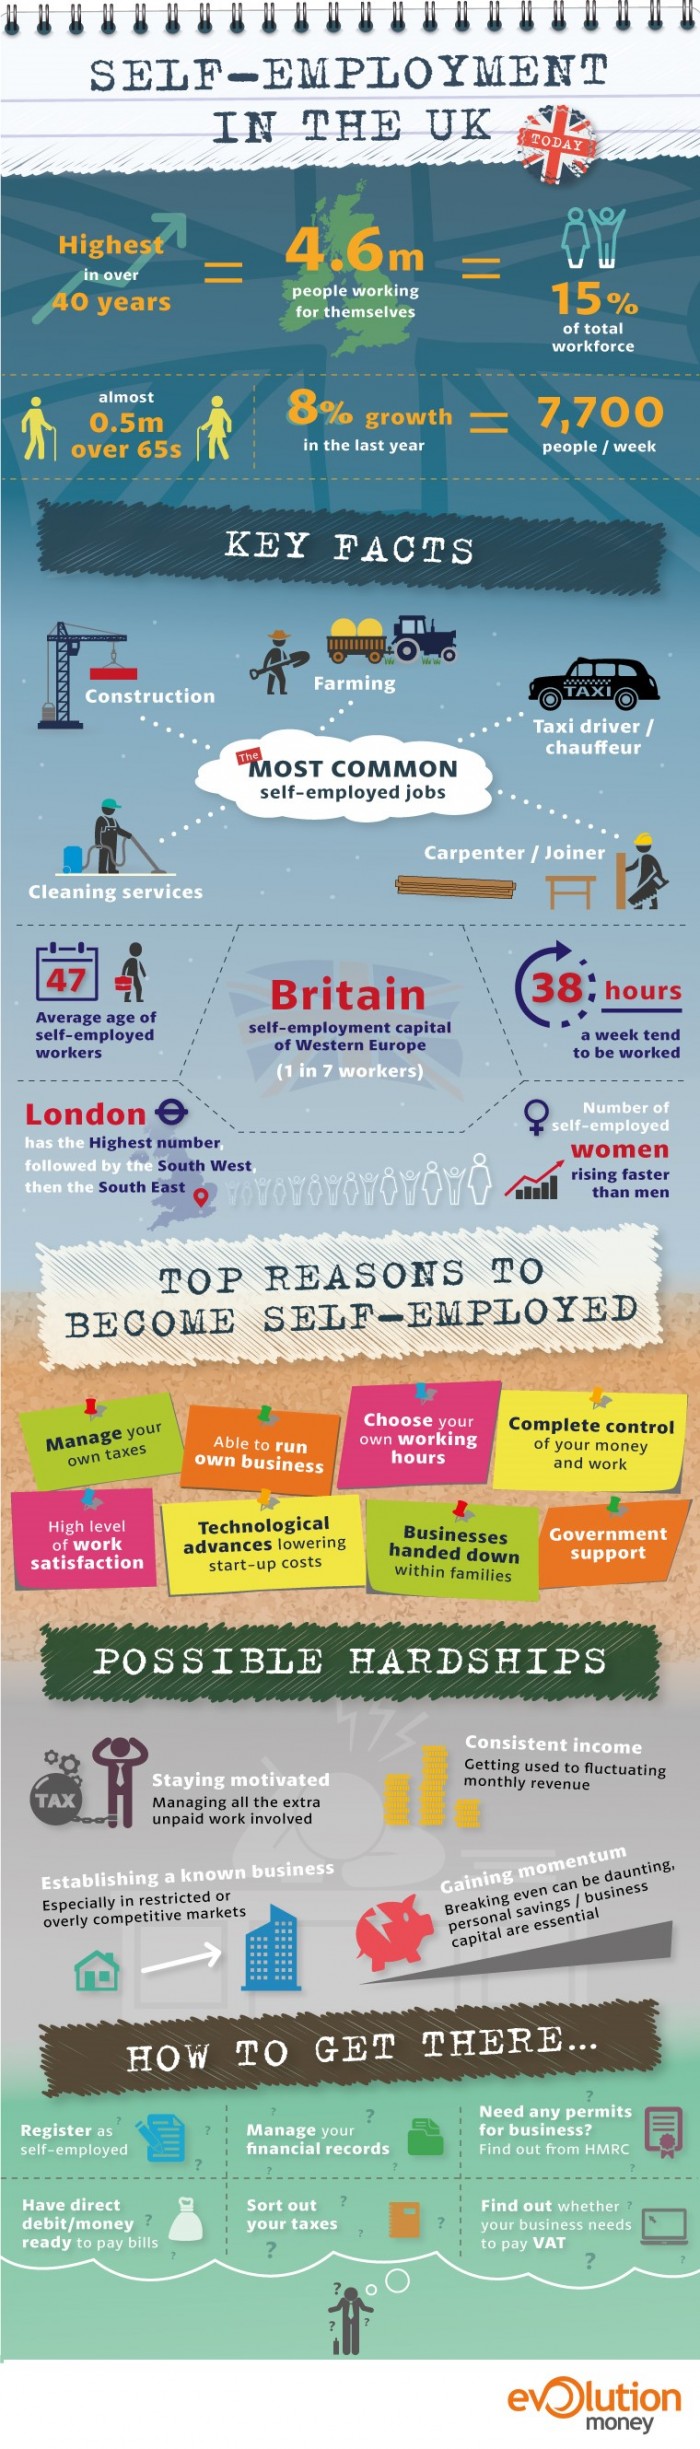
Self-Employment in the UK infographic by Evolution Money covers this topical subject in detail and offers statistics and advice on being self-employed.
What I find most interesting in the data is the most common professions for the self-employed: construction, farming, cleaning, taxi driver and joiner.
The infographic starts out with a strong collection of stats clearly delivered as an introduction to the piece. Each section is then clearly divided by the use of background colour and texture. Statistics are well highlighted and all text is clear and easy to read. Use of graphic icons illustrates the information. The graphic offers a range of information ending in tips and advice on being self-employed.
Overall this is a well delivered infographic with a good range of data about it’s subject. Self-Employment in the UK infographic gets a 7 out of 10.